Choice-Based Conjoint Analysis of Netflix
Note 2025: This is based on a course I took in 2023. It's been a while since I wrote this, glad I grew a lot since then.
In the competitive streaming industry, maintaining a leading edge requires continuous innovation and a deep understanding of consumer preferences. Netflix, as a major player in this sector, faces the challenge of constantly improving its service offerings to align with evolving market demands.
This article explores the role of choice-based conjoint analysis, a sophisticated market research technique, in addressing this challenge. By implementing this method, Netflix can gain valuable insights into consumer decision-making processes, guiding the development of its product strategies and enhancing its market position.
So how do we start
When you dont have any data to work with, you need to gather it first. One way is by creating market research.
First, lets look at a typical survey. This might have some questions, like “How much would you like [Feature X]” and “How willing are you to pay for [Feature X]. However the problem is that we ask people of features. People don’t buy features, they buy products.
This is where Choice-Based Conjoint analysis comes in to play. Customers are surveyed on products and their characteristics. We don’t individualize the features.
So What do we get in the end?
- A statistic on the importance and relevance of a feature (e.g. no ads delivered the most result)
- A graphic which shows the relevance of the features of an attribute
- A (hopefully) successful product with the best combinations of features
So lets start with a Problem statement…
The Problem Statement
We need to find ways to imporve netlix’ Product to drive growth. The challenge is, how do you figuire out the best combination of features for the most profitable, most wanted product. Specifically, we want to:
- Increase the number of subscriptions
- Increate the price
- Add revenue streams
- Add new markets
Step 1: Designing the survey
The first step is to design a survey that effectively captures the attributes and levels of the products being analyzed. This requires careful consideration to ensure that the survey questions are relevant, unbiased, and comprehensive.
A Choice based conjoint analysis survey has attributes and levels. For example:
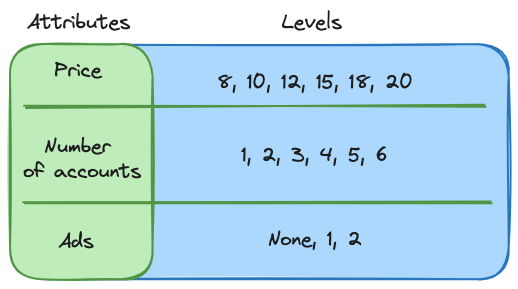
We would then create Products, and ask customers on which one they would buy. This is done by taking the attributes and a leven and creating options.
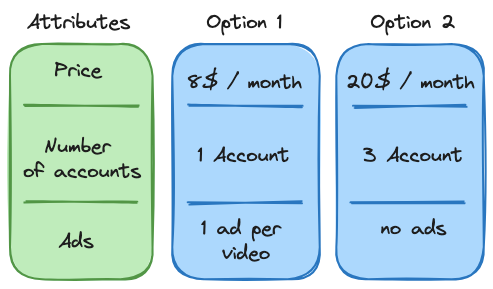
By having a customer, continuously choose their prefered product, we can statistically find the best possible product we could deliver to our client and which features add the most value.
Step 2: Data Collection
Once the survey is designed, the next step is data collection. This involves administering the survey to a representative sample of the target audience and gathering their responses. The quality and reliability of the data collected are crucial for accurate analysis.
There are multiple possible ways we could collect this data:
- Online Surveys
- Focus Grous
- In-app Feedback
- Social Media polls
- A/BTesting
- Third-party Market research firms
After having collected this data, we would have to clean it. Data is never perfect. So we need to remove these ‘imperfections’, like duplicates, missing values and Outliers. Specifically, we need to do the following:
- Identification and Removal of Outliers
- Handling Missing Data
- Ensuring Consistency
- Standardization of data formats
- Verification of Response Quality
Step 3: Data Analysis and Interpretation
After collecting the data, it’s crucial to process it to extract meaningful insights. This stage utilizes statistical methods, specifically logistic regression, to understand the impact of each product attribute on customer choice. By inputting the product attributes as independent variables, such as price, ads, extra content, and the number of accounts, and the selection status (chosen or not chosen) as the dependent variable, the logistic regression model estimates the likelihood of a product being selected based on its features.
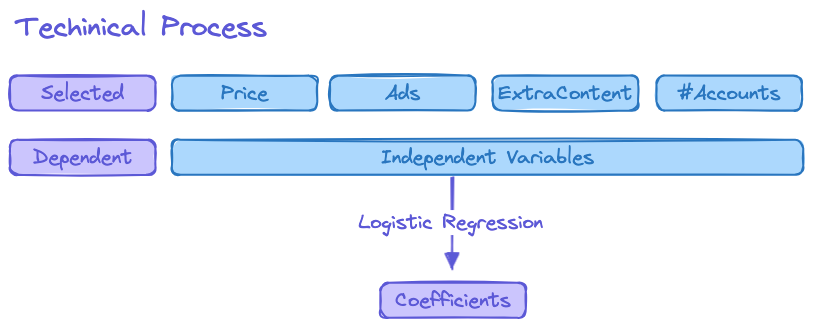
The model outputs coefficients for each attribute, which quantify their influence on the probability of a product’s selection. A higher coefficient value indicates a greater positive impact on selection likelihood, whereas a negative coefficient suggests a deterrent effect.
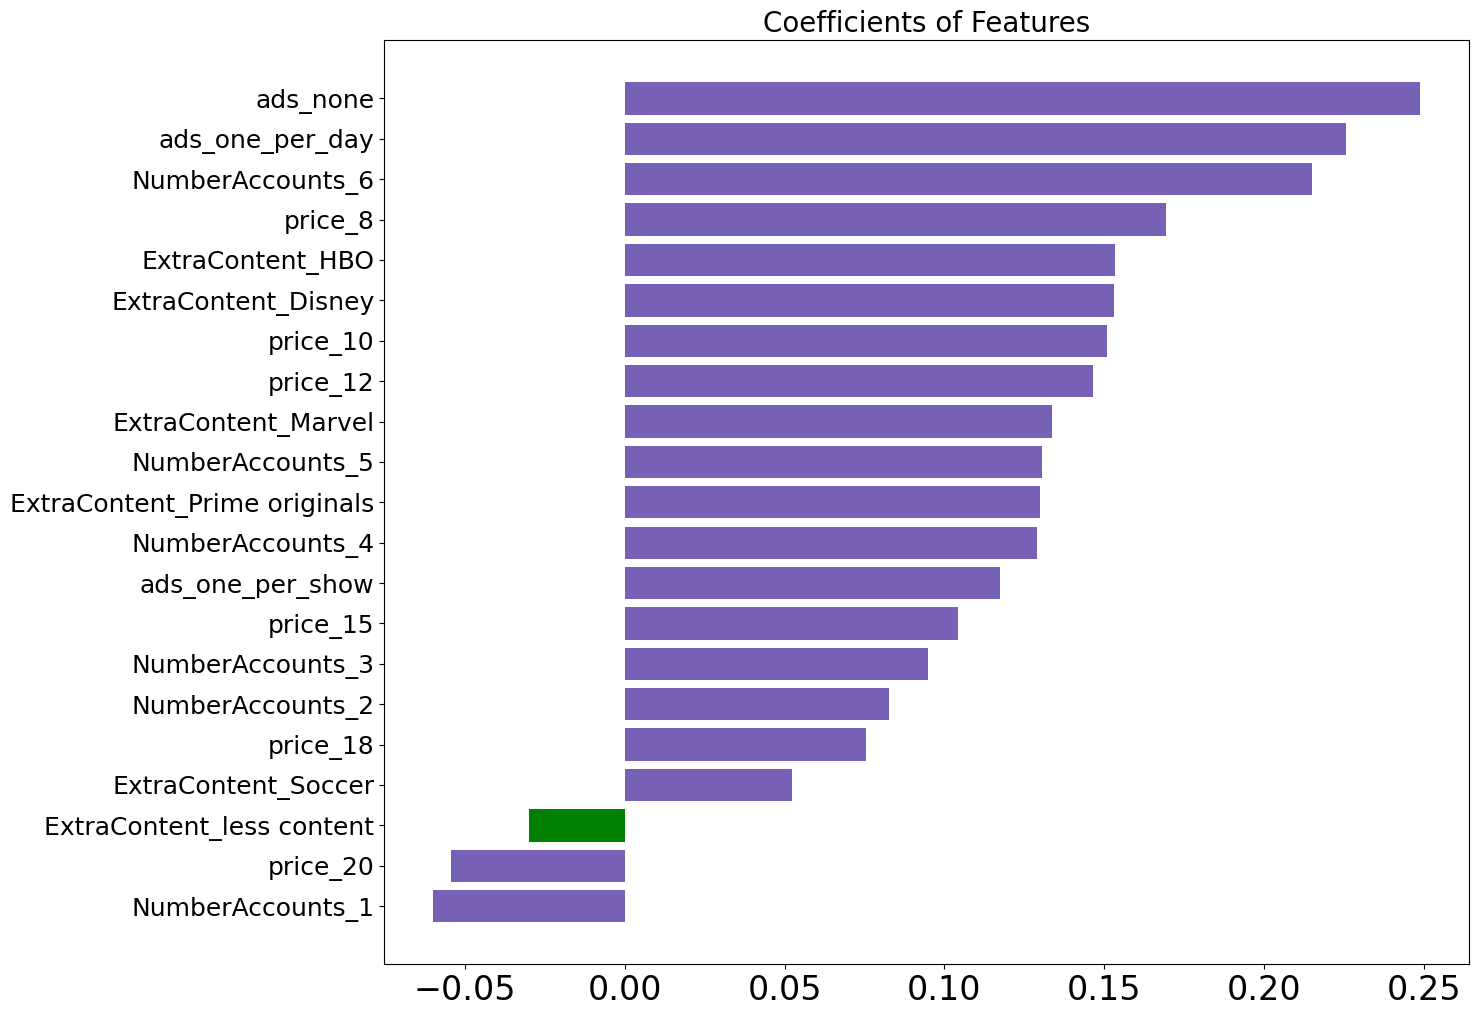
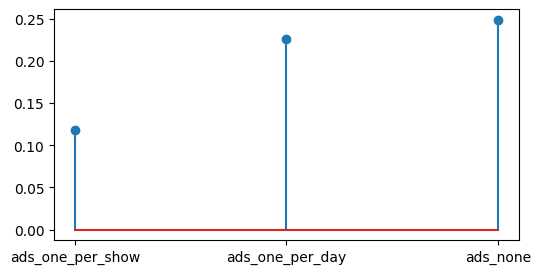
Lastly, the results are presented in a way that highlights the most and least preferred attributes. For instance, a feature with a high positive coefficient is highly valued by customers, which in this case could be the absence of ads
Through this analysis, Netflix can discern which features contribute most to a product’s appeal, thereby guiding future product development and marketing strategies.
Determining Feature Importance
Determining the importance of different features is vital to understanding consumer preferences. The process involves calculating the ‘part-worth’ of each feature, which is the sum of the coefficients from the logistic regression model related to that feature. This gives us an array of part-worths for each feature that indicates its impact on the customer’s choice.
We then measure the importance of a feature by the range of its part-worths — the difference between the maximum and minimum part-worth values. This range represents the total impact that a feature has on the preference.
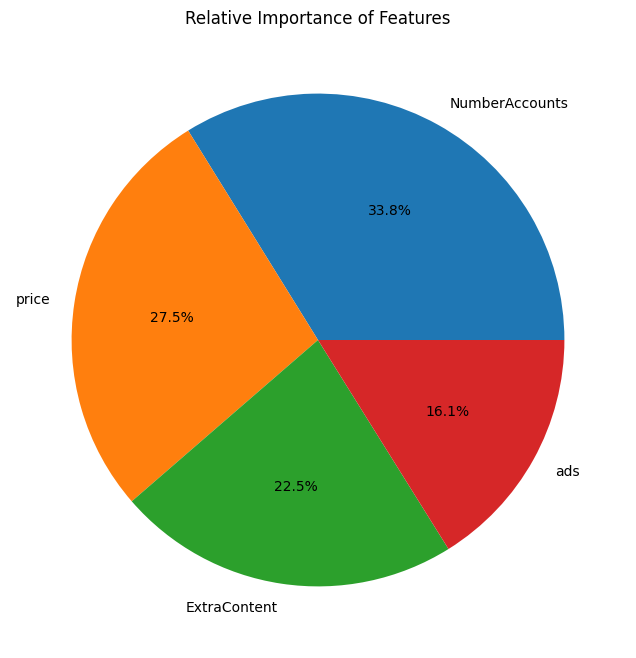
Finally, to put these into perspective, we calculate the relative importance of each feature. This is done by dividing the importance of each feature by the sum of importances across all features, then multiplying by 100 to get a percentage. This percentage reflects how much each feature contributes to the choice relative to the others.
Through these calculations, we can present a clear picture of which features are most likely to influence customer decisions and should, therefore, be prioritized in product development.
Project Conclusion
The conjoint analysis revealed a hierarchy of feature preferences among users, with the number of accounts and pricing emerging as the most influential factors in subscription decisions. These are followed by the type and volume of extra content offered, which suggests that users place significant value on content diversity. Advertisements appear to have the least impact on user preferences, which may indicate a higher tolerance for ads if the trade-offs in content or pricing are favorable.
Considering the findings, the next steps would involve a detailed financial analysis to balance ad revenue against potential impacts on user satisfaction and retention. Additionally, evaluating the costs and returns of introducing new content is essential for strategic planning.
Lastly, while the analysis provides valuable insights, it is important to acknowledge limitations such as the assumption of static market conditions and the potential impact of additional levels or options not included in the initial study. These factors should be taken into account when applying these conclusions to business decisions.